![]()


![]()
![]()
研究成果 Research Results
- TOP
- News
- Research Results
- Mapping radioactive microparticles
Mapping radioactive microparticles
Quantification of cesium-rich microparticle distribution provides new insights 2019.11.12Research ResultsPhysics & ChemistryEnvironment & Sustainability
Applying an original method to quantify specific radioactive particles in soil, a team led by Satoshi Utsunomiya, associate professor of Kyushu University’s Department of Chemistry, has constructed the first quantitative map of cesium-rich microparticles around the power plant at the center of the nuclear disaster following the Great East Japan Earthquake in March 2011, providing an important tool for understanding how such particles spread.
During the events that unfolded after an earthquake and ensuing tsunami disrupted operation at the Fukushima Daiichi Nuclear Power Plant in northeastern Japan, the damaged nuclear reactors emitted several plumes of gas containing radioactive materials. Among these materials were small particles only a few micrometers in diameter containing high concentrations of radioactive cesium. These particles—called cesium-rich microparticles—have attracted particular attention because they can hold a relatively large amount of radioactivity for their weight and do not easily dissolve in water.
To better understand the distribution, source, and movement of these microparticles, Utsunomiya’s team applied for the first time on a large sample set a unique method they developed to quantify the microparticles. In a paper published in Chemosphere, lead authors Kazuya Morooka and Ryohei Ikehara report that analysis of soil from 20 locations around the affected area led to a distribution that is closely associated with the trajectories of major radioactive plumes released from the power plants.
“By mapping the number of microparticles per gram of soil and the fraction of radioactivity contributed by the cesium-rich microparticles in surface soil, we could identify three regions of particular interest around the power plants: near northwest, far northwest, and southwest,” says Utsunomiya, who coordinated this international collaborative research with Tsukuba University, Tokyo Institute of Technology, National Institute of Polar Research, Institute of Applied Energy, University of Helsinki, University of Nantes, and Stanford University.
In the nearby regions, the microparticles only contributed a small fraction to the overall high radioactivity measured despite their large numbers, indicating water-soluble forms of cesium not contained in microparticles are the major radioactive component. In the far northwest, both forms of cesium were found to contribute to the overall radioactivity, while the microparticles are the main contributor in the southwest.
Comparing these distributions with the trajectories of major plumes released from the power plant, the researchers concluded that the microparticles were formed only during a short period starting in the late afternoon on March 14, 2011, and continuing to the late afternoon of March 15, 2011, with Unit 3 being the most plausible source of the microparticles.
“This quantitative map of the distribution of cesium-rich microparticles not only provides an important understanding of how they originated and disperse but also can be used to assess risks in inhabited regions,” comments Utsunomiya.
For more information about this research, see “Abundance and distribution of radioactive cesium-rich microparticles released from the Fukushima Daiichi Nuclear Power Plant into the environment”, Ryohei Ikehara, Kazuya Morooka, Mizuki Suetake, Tatsuki Komiya, Eitaro Kurihara, Masato Takehara, Ryu Takami, Chiaki Kino, Kenji Horie, Mami Takehara, Shinya Yamasaki, Toshihiko Ohnuki, Gareth T.W. Law, William Bower, Bernd Grambow, Rodney C. Ewing, and Satoshi Utsunomiya, Chemosphere 241, 125019 (2019), https://doi.org/10.1016/j.chemosphere.2019.125019
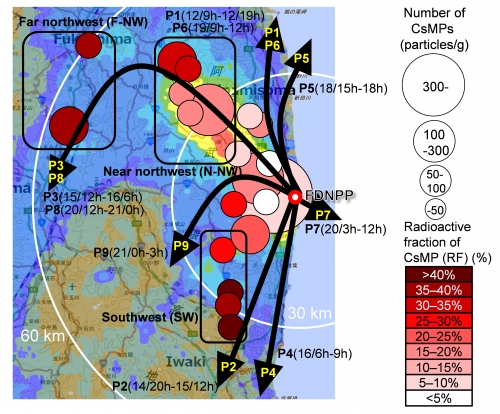
Figure caption. Comparison of the cesium-rich microparticle (CsMP) distribution map with the trajectory of major plumes containing radioactive materials. The underlying map of total 134+137Cs radioactivity was modified with permission from the Extension Site of Distribution Map of Radiation Dose/GSI Maps. The black arrows represent plume trajectories, with plume numbering following the classification scheme from Nakajima et al., Prog. Earth. Planet Sci. 4, 2 (2017). The numbers in parentheses beside the plume numbers indicate the period (day in March/time) of the plume release.
Journal Reference
Abundance and distribution of radioactive cesium-rich microparticles released from the Fukushima Daiichi Nuclear Power Plant into the environment, ,Chemosphere, https://doi.org/10.1016/j.chemosphere.2019.125019Research-related inquiries
- TOP
- News
- Research Results
- Mapping radioactive microparticles